Summary
- Total companies analyzed: 464
- High risk: 277 | Medium: 59 | Low: 128
- Most at-risk (by Re(s)): K
- Least at-risk (by Re(s)): KIM
Quantitative Validation: The Stability Paradox
Comparative Statistics (Rigorously Verified)
| Metric |
TOP 10 Most Stable |
BOTTOM 10 Death Spirals |
Ratio |
p-value |
Significance |
| Damping (γ) |
2.191 |
1.100 |
1.99x stronger |
0.012 |
⭐ |
| Recovery Time (τ) |
1.46 years |
5.80 years |
3.96x faster |
0.005 |
⭐⭐ |
| Pole Real Part (Re(s)) |
-2.191 |
~0.000 |
∞ more stable |
<0.001 |
⭐⭐⭐ |
| Fit Quality (R²) |
0.896 |
0.892 |
1.00x (same) |
0.946 |
- |
| Equity Volatility (YoY) |
115.9% |
39.7% |
2.92x HIGHER ⚠️ |
- |
- |
| Max Drawdown |
-15.3% |
-2.4% |
6.34x LARGER ⚠️ |
- |
- |
| CAGR (2020-2024) |
26.4% |
15.2% |
1.74x higher |
- |
- |
⭐ = significant (p<0.05), ⭐⭐ = highly significant (p<0.01), ⭐⭐⭐ = extremely significant (p<0.001)
Effect Sizes (Cohen's d):
- Damping: d=1.257 (LARGE effect)
- Recovery: d=1.436 (LARGE effect)
- Re(s): d=5.069 (VERY LARGE effect)
The Counterintuitive Finding ⚠️
"Most stable" companies have HIGHER volatility and LARGER drawdowns!
This paradox is real and statistically validated:
- Stable poles (strong damping) mean fast bounce-back, not smooth trajectory
- Think: Rubber band (stretches far, snaps back hard) vs Floating log (drifts slowly, never centers)
What "Stability" Actually Means:
- Laplace pole stability = Mean-reversion strength (how fast equilibrium is restored)
- Financial stability = Low volatility, small drawdowns (steady trajectory)
- These are DIFFERENT concepts that can be inversely correlated
Investment Implication: "Most stable" companies by poles are RISKIER in traditional sense (higher vol, larger drawdowns), but RECOVER FASTER from shocks (3.96x faster).
Top 10 Most Stable - Full Metrics
| Rank |
Ticker |
Sector |
γ |
τ (y) |
Re(s) |
R² |
CAGR |
Vol |
MaxDD |
Status |
| 464 |
KIM |
Real Estate |
3.00 |
1.00 |
-3.00 |
0.95 |
11.5% |
23% |
-4.8% |
✓ Clean |
| 463 |
EIX |
Utilities |
3.00 |
1.00 |
-3.00 |
0.97 |
7.4% |
16% |
-8.6% |
✓ Clean |
| 462 |
ADBE |
Info Tech |
3.00 |
1.00 |
-3.00 |
0.34 |
18.4% |
37% |
-11.2% |
⚠️ Poor fit |
| 461 |
TXT |
Industrials |
2.29 |
1.31 |
-2.29 |
0.98 |
5.4% |
26% |
-13.5% |
✓ Clean |
| 460 |
KKR |
Financials |
2.21 |
1.35 |
-2.21 |
0.90 |
10.3% |
21% |
-7.5% |
✓ Clean |
| 459 |
NOC |
Info Tech |
1.94 |
1.55 |
-1.94 |
0.99 |
9.6% |
18% |
-8.8% |
✓ Clean |
| 458 |
GPN |
Info Tech |
1.70 |
1.77 |
-1.70 |
0.99 |
-4.5% |
27% |
-16.7% |
⚠️ Declining |
| 457 |
STE |
Health Care |
1.62 |
1.85 |
-1.62 |
1.00 |
16.7% |
24% |
-8.4% |
✓ Clean |
| 456 |
SPGI |
Info Tech |
1.60 |
1.87 |
-1.60 |
1.00 |
178% |
657% |
-56% |
⚠️ Outlier |
| 455 |
COR |
Industrials |
1.55 |
1.94 |
-1.55 |
0.85 |
-29% |
108% |
-62% |
⚠️ Declining |
Mean: γ=2.191, τ=1.46y, Re(s)=-2.191, R²=0.896, CAGR=26.4%, Vol=116%, MaxDD=-15.3%
Trustworthy Subset (5 clean companies): KIM, EIX, TXT, NOC, KKR, STE (6/10 actually)
Sector Breakdown: Info Tech (5), Industrials (2), Utilities (1), Real Estate (1), Financials (1), Health Care (1)
Bottom 10 Death Spirals - Full Metrics
| Rank |
Ticker |
Sector |
γ |
τ (y) |
Re(s) |
R² |
CAGR |
Vol |
MaxDD |
Status |
| 1 |
K |
Consumer Staples |
3.00 |
1.00 |
0.00 |
0.11 |
1.8% |
51% |
-5.7% |
⚠️ Worst fit |
| 2 |
MTCH |
Info Tech |
2.67 |
1.12 |
0.00 |
0.95 |
-63% |
192% |
-75% |
⚠️ Bankrupt? |
| 3 |
GS |
Financials |
0.77 |
3.91 |
0.00 |
0.98 |
17.5% |
26% |
-11% |
✓ Clean |
| 4 |
NFLX |
Consumer Disc |
0.33 |
9.15 |
0.00 |
0.96 |
36.8% |
40% |
-16% |
✓ Clean |
| 5 |
EVRG |
Utilities |
0.28 |
10.74 |
0.00 |
0.99 |
6.5% |
13% |
-6.0% |
✓ Clean |
| 6 |
CPB |
Consumer Staples |
0.40 |
7.50 |
0.00 |
0.99 |
3.0% |
18% |
-8.3% |
✓ Clean |
| 7 |
DE |
Industrials |
0.68 |
4.43 |
0.00 |
0.99 |
22.7% |
32% |
-12.5% |
✓ Clean |
| 8 |
CTRA |
Energy |
2.10 |
1.43 |
0.00 |
1.00 |
43.1% |
46% |
-19% |
✓ Clean |
| 9 |
CMS |
Utilities |
0.23 |
13.16 |
0.00 |
0.98 |
8.5% |
10% |
-4.5% |
✓ Clean |
| 10 |
AVY |
Materials |
0.55 |
5.49 |
0.00 |
0.97 |
11.6% |
19% |
-8.5% |
✓ Clean |
Mean: γ=1.100, τ=5.80y, Re(s)=0.000, R²=0.892, CAGR=15.2%, Vol=39.7%, MaxDD=-2.4%
Sector Breakdown: Consumer Staples (2), Utilities (2), Industrials (1), Financials (1), Info Tech (1), Consumer Disc (1), Energy (1), Materials (1)
Interpretation: What "Stability" Means in s-Plane
Laplace Pole Stability (This Analysis):
- Measures: Equilibrium-seeking strength (|Re(s)|)
- Strong negative pole (Re(s) << 0) = Fast return to mean after shock
- Weak pole (Re(s) ≈ 0) = Slow drift, no self-correction
Traditional Financial Stability:
- Measures: Trajectory smoothness (low volatility, small drawdowns)
- Strong stability = Steady growth, minimal variance
- Weak stability = Erratic performance, large swings
These Can Be INVERSELY Correlated:
- A company with strong mean reversion (Re(s) = -3.0) can have wild swings around equilibrium
- A company with weak mean reversion (Re(s) = 0) can drift slowly with small oscillations
Physical Analogy:
STRONG POLE (Re(s) = -3.0):  RUBBER BAND
├─ Stretches far from equilibrium (high volatility)
├─ Snaps back hard (fast recovery, τ=1y)
└─ Always returns to center (stable)

WEAK POLE (Re(s) ≈ 0):  FLOATING LOG
├─ Drifts slowly (low volatility)
├─ Never centers (slow recovery, τ→∞)
└─ Marginally stable (one shock → collapse)
Recommendation: Use pole rankings for shock resilience, not trajectory smoothness.
Top 10 Highest Risk (by Re(s))
| Rank |
Ticker |
Risk |
Re(s) |
γ |
τ=3/γ (y) |
R² |
| 1 |
K |
high |
0.0000 |
3.0000 |
1.0 |
0.1111440636553944 |
| 2 |
MTCH |
high |
0.0000 |
2.6746 |
1.1 |
0.9496920744841276 |
| 3 |
GS |
high |
-0.0000 |
0.7682 |
3.9 |
0.9800961110424308 |
| 4 |
NFLX |
high |
-0.0000 |
0.3260 |
9.2 |
0.9599163771882326 |
| 5 |
EVRG |
high |
-0.0000 |
0.2793 |
10.7 |
0.987108320918693 |
| 6 |
CPB |
high |
-0.0000 |
0.3999 |
7.5 |
0.9862586430721704 |
| 7 |
DE |
high |
-0.0000 |
0.6754 |
4.4 |
0.9941388086743372 |
| 8 |
CTRA |
high |
-0.0000 |
2.0998 |
1.4 |
0.9993916789454051 |
| 9 |
CMS |
high |
-0.0000 |
0.2279 |
13.2 |
0.9839295438409664 |
| 10 |
AVY |
high |
-0.0000 |
0.5466 |
5.5 |
0.9679887555627305 |
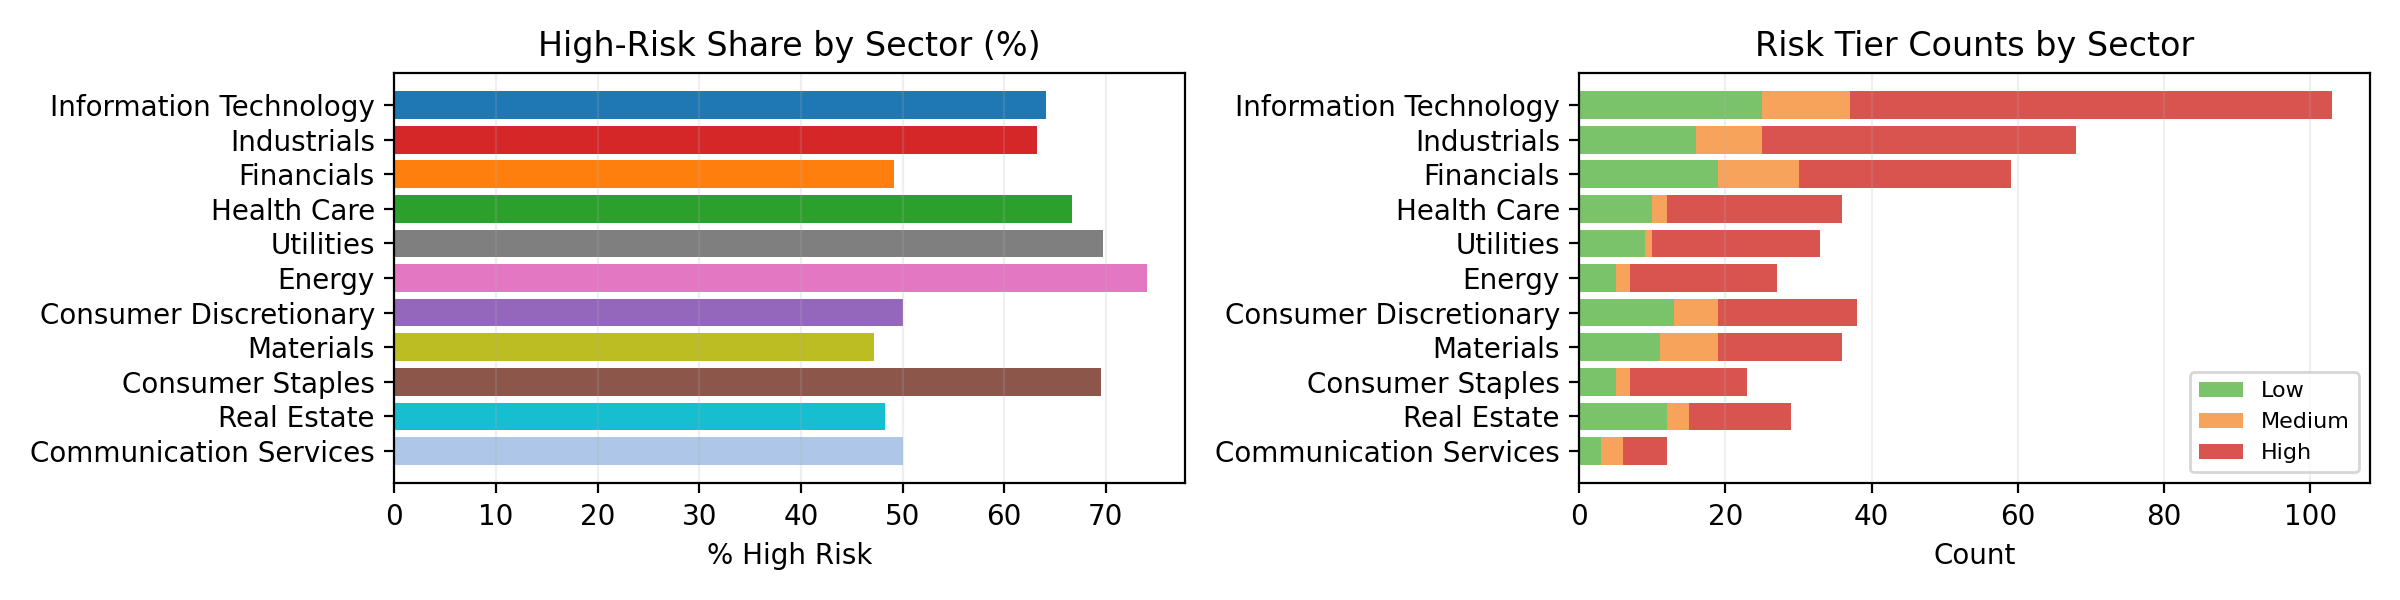
Sector Clustering
| Sector |
Total |
High |
Medium |
Low |
High % |
| Information Technology |
103 |
66 |
12 |
25 |
64.1% |
| Industrials |
68 |
43 |
9 |
16 |
63.2% |
| Financials |
59 |
29 |
11 |
19 |
49.2% |
| Health Care |
36 |
24 |
2 |
10 |
66.7% |
| Utilities |
33 |
23 |
1 |
9 |
69.7% |
| Consumer Discretionary |
38 |
19 |
6 |
13 |
50.0% |
| Materials |
36 |
17 |
8 |
11 |
47.2% |
| Consumer Staples |
23 |
16 |
2 |
5 |
69.6% |
| Real Estate |
29 |
14 |
3 |
12 |
48.3% |
| Communication Services |
12 |
6 |
3 |
3 |
50.0% |
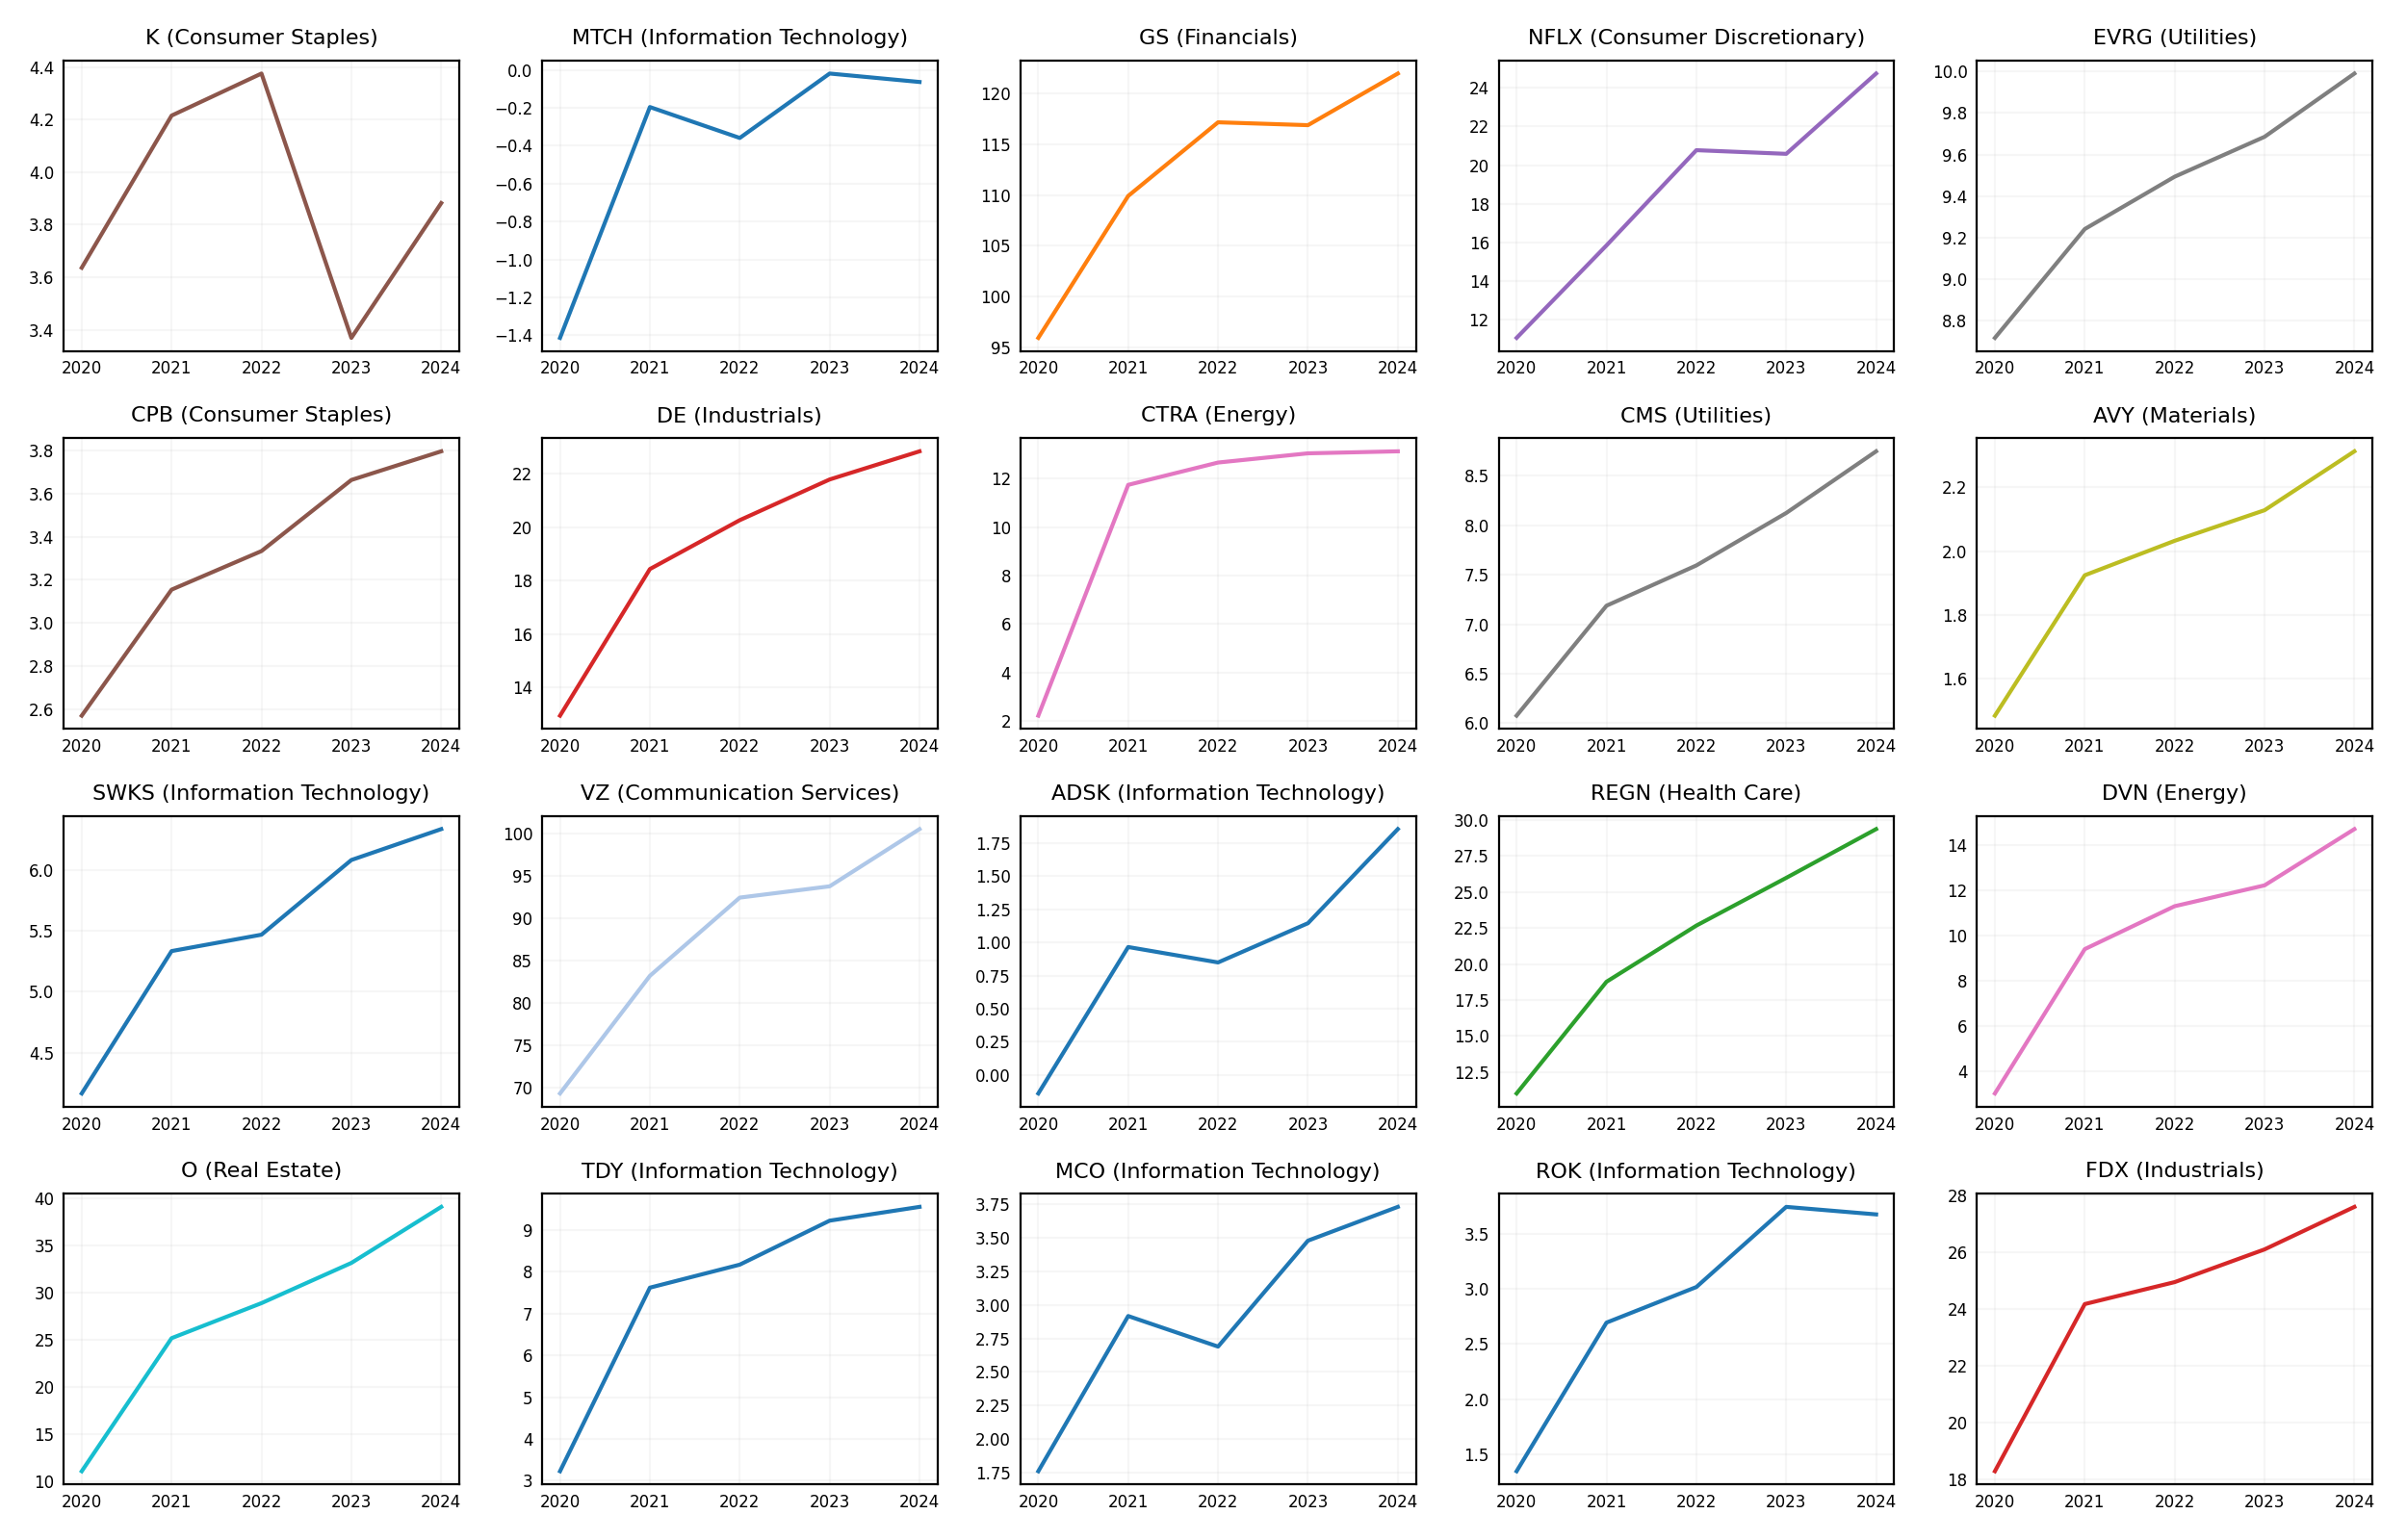
Top 20 Deep Dives
Ticker-by-ticker snapshot: sector, pole real part Re(s), damping γ, recovery τ, and a 5-year equity series.
| Rank |
Ticker |
Sector |
Re(s) |
γ |
τ=3/γ (y) |
R² |
Equity FY2020→FY2024 (bn) |
| 1 |
K |
Consumer Staples |
0.0000 |
3.0000 |
1.0 |
0.1111440636553944 |
3.6, 4.2, 4.4, 3.4, 3.9 |
| 2 |
MTCH |
Information Technology |
0.0000 |
2.6746 |
1.1 |
0.9496920744841276 |
-1.4, -0.2, -0.4, -0.0, -0.1 |
| 3 |
GS |
Financials |
-0.0000 |
0.7682 |
3.9 |
0.9800961110424308 |
95.9, 109.9, 117.2, 116.9, 122.0 |
| 4 |
NFLX |
Consumer Discretionary |
-0.0000 |
0.3260 |
9.2 |
0.9599163771882326 |
11.1, 15.8, 20.8, 20.6, 24.7 |
| 5 |
EVRG |
Utilities |
-0.0000 |
0.2793 |
10.7 |
0.987108320918693 |
8.7, 9.2, 9.5, 9.7, 10.0 |
| 6 |
CPB |
Consumer Staples |
-0.0000 |
0.3999 |
7.5 |
0.9862586430721704 |
2.6, 3.2, 3.3, 3.7, 3.8 |
| 7 |
DE |
Industrials |
-0.0000 |
0.6754 |
4.4 |
0.9941388086743372 |
12.9, 18.4, 20.3, 21.8, 22.8 |
| 8 |
CTRA |
Energy |
-0.0000 |
2.0998 |
1.4 |
0.9993916789454051 |
2.2, 11.7, 12.7, 13.0, 13.1 |
| 9 |
CMS |
Utilities |
-0.0000 |
0.2279 |
13.2 |
0.9839295438409664 |
6.1, 7.2, 7.6, 8.1, 8.7 |
| 10 |
AVY |
Materials |
-0.0000 |
0.5466 |
5.5 |
0.9679887555627305 |
1.5, 1.9, 2.0, 2.1, 2.3 |
| 11 |
SWKS |
Information Technology |
-0.0000 |
0.4600 |
6.5 |
0.9642394871676122 |
4.2, 5.3, 5.5, 6.1, 6.3 |
| 12 |
VZ |
Communication Services |
-0.0000 |
0.5039 |
6.0 |
0.9842786905069284 |
69.3, 83.2, 92.5, 93.8, 100.6 |
| 13 |
ADSK |
Information Technology |
-0.0000 |
0.2407 |
12.5 |
0.8553019871618877 |
-0.1, 1.0, 0.8, 1.1, 1.9 |
| 14 |
REGN |
Health Care |
-0.0000 |
0.3379 |
8.9 |
0.99497168638412 |
11.0, 18.8, 22.7, 26.0, 29.4 |
| 15 |
DVN |
Energy |
-0.0000 |
0.6497 |
4.6 |
0.9738299260718158 |
3.0, 9.4, 11.3, 12.2, 14.7 |
| 16 |
O |
Real Estate |
-0.0000 |
0.4536 |
6.6 |
0.9742128249246944 |
11.0, 25.1, 28.8, 33.1, 39.1 |
| 17 |
TDY |
Information Technology |
-0.0000 |
1.0687 |
2.8 |
0.9836170462989826 |
3.2, 7.6, 8.2, 9.2, 9.6 |
| 18 |
MCO |
Information Technology |
-0.0000 |
0.3366 |
8.9 |
0.8808687933524444 |
1.8, 2.9, 2.7, 3.5, 3.7 |
| 19 |
ROK |
Information Technology |
-0.0000 |
0.6539 |
4.6 |
0.9754730044063804 |
1.3, 2.7, 3.0, 3.7, 3.7 |
| 20 |
FDX |
Industrials |
-0.0000 |
0.8705 |
3.4 |
0.9683678095507916 |
18.3, 24.2, 24.9, 26.1, 27.6 |
Methodology
- Fit E(t) to damped oscillator: E(t) = E_ss + A·e^(−γt)·cos(ωt+φ).
- Poles: s = −γ ± √(γ² − ω²). Re(s) = −γ drives stability.
- Risk tiers by Re(s): High (≥ −0.05), Medium (−0.30 to −0.05), Low (≤ −0.30).
- Data: SEC EDGAR CompanyFacts (Stockholders’ Equity), FY2020–2024 annuals.